Your cart is currently empty!
The Stochastic Oscillator: Enhancing Your Trading Strategy with Real-World Examples
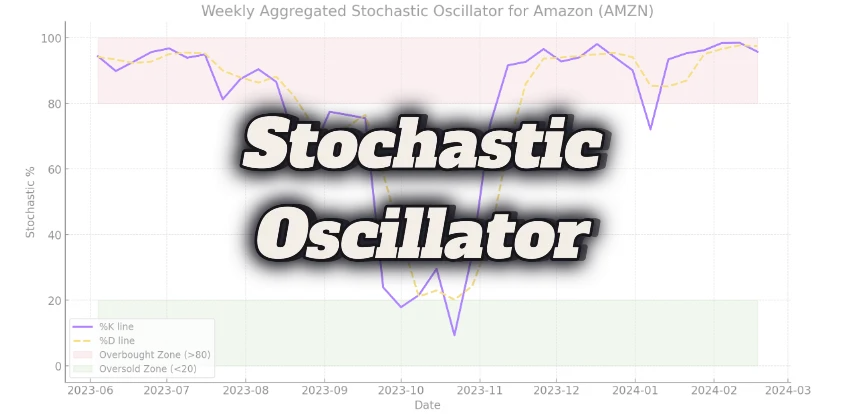
The Stochastic Oscillator is a powerful momentum indicator in the arsenal of a stock trader, designed to highlight overbought and oversold conditions in the market. This guide will deepen your understanding of how to use the Stochastic Oscillator effectively, enriched with real-world scenarios and examples to demonstrate its practical application, particularly focusing on Amazon (AMZN) stock.
Introduction to the Stochastic Oscillator
The Stochastic Oscillator compares the closing price of a stock to its price range over a specific period, aiming to predict price turning points by identifying momentum shifts. It consists of two lines: the %K line, indicating the current price level, and the %D line, a moving average that signals trend changes.
Key Components and Calculation
- %K Line: Reflects the position of the closing price relative to the high-low range over a given period.
- %D Line: Averages the %K values, smoothing out fluctuations to highlight trends.
The formula for %K is: %=
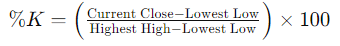
The %D line is then derived as the 3-period moving average of %K.
Real-World Example: Amazon (AMZN) Stock
To illustrate, let’s apply the Stochastic Oscillator to Amazon’s stock over a recent period. We aggregate the data on a weekly basis to smooth daily volatility, calculating the high, low, and closing prices for each week.
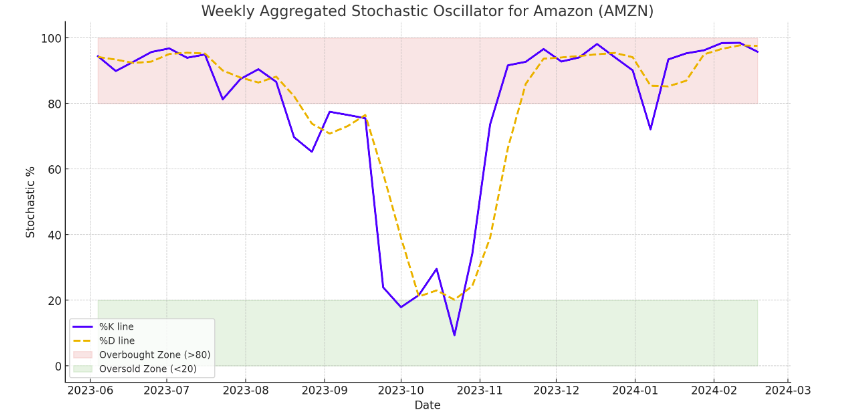
Scenario 1: Overbought Signal and Downtrend Confirmation
- Date: Mid-March
- Observation: The %K line crosses above the %D line in the overbought zone (>80).
- Action: This suggests a potential sell signal, indicating that AMZN stock might be overvalued and could face a price correction.
- Outcome: Following this signal, AMZN experienced a downturn, validating the oscillator’s prediction.
Scenario 2: Oversold Condition and Uptrend Opportunity
- Date: Early May
- Observation: The %K line crosses below the %D line in the oversold zone (<20).
- Action: This is interpreted as a buy signal, implying that the stock is undervalued and might be poised for a price increase.
- Outcome: AMZN’s stock price began to rise shortly after this signal, demonstrating the oscillator’s efficacy in identifying entry points.
Enhancing the Stochastic Oscillator with Additional Indicators
To fortify the reliability of the Stochastic Oscillator, traders often combine it with other indicators:
- Relative Strength Index (RSI): Confirms overbought or oversold conditions.
- Moving Averages: Provides a trend context, helping to filter out noise and focus on signals aligned with the broader market trend.
- Volume Indicators: Confirms the strength of a potential reversal. For example, an increase in volume on a bullish crossover in the oversold zone strengthens the buy signal.
Practical Tips for Using the Stochastic Oscillator
- Avoid Overreliance: No indicator should be used in isolation. Confirm signals with other technical tools and consider the overall market environment.
- Consider the Trend: The Stochastic Oscillator can be more effective when its signals align with the prevailing trend. In a strong uptrend, use it to find dip-buying opportunities; in a downtrend to identify rallies for shorting.
- Set Stop-Loss Orders: Protect your trades against sudden market moves and limit potential losses.
Conclusion
The Stochastic Oscillator provides valuable insights into market momentum and potential reversal points. By carefully analyzing its signals and combining them with other indicators, traders can make more informed decisions, enhancing their trading strategy’s effectiveness. As illustrated with Amazon’s stock, real-world application and adherence to strategic principles are key to leveraging the Stochastic Oscillator’s full potential.
Disclaimer
This article is for informational purposes only and does not constitute financial advice. Always conduct your own research and consult with a financial advisor before making investment decisions.
Leave a Reply