Cracking the Money Code: Your Daily Dose of Finance, Tech, and Market Smarts
Fibonacci Retracements: A Hidden Pattern in Options Trading
Picture a stock price moving like a wave on the ocean. It doesn’t just move in a straight line – there are rises and falls, peaks and valleys. Fibonacci retracement is a technical analysis tool that attempts to predict where prices might find support (a stopping point during a drop) or resistance (a stopping point during a rise). Think of them as potential turning points where a stock’s momentum might shift.
The Magic of Fibonacci (Well, Sort of)
The Fibonacci retracement strategy draws its inspiration from a sequence of numbers identified by an Italian mathematician centuries ago. This sequence creates specific ratios – 23.6%, 38.2%, 61.8%, and others – that traders look for. Why these numbers? The honest answer is that this pattern shows up a surprising amount of time in price movements. Whether this is simply due to psychology or some deeper market rhythm is up for debate.
How to Use Fibonacci Retracements
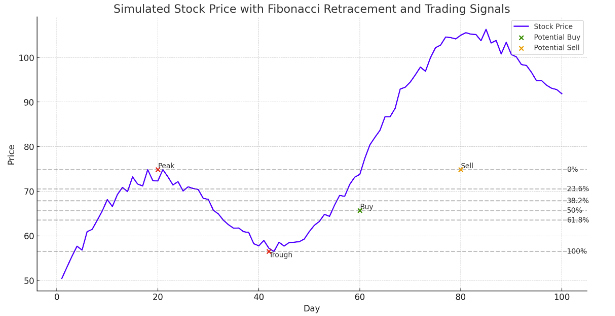
Photo: Fibonacci Simulated | EconEgg
Here’s the basic idea:
Find Your Swing: Identify a significant high point (peak) and a significant low point (valley) on a stock chart.
Draw Your Lines: Use your charting software’s Fibonacci retracement tool to draw horizontal lines across the chart corresponding to those pre-determined ratios between your high and low.
Watch for Reactions: These lines are your areas to watch. If the price of the stock reaches one of these Fibonacci lines, it might bounce back in the other direction.
Beginner Strategy
Start simple. Look for those Fibonacci levels after a major stock move. When you see the price approaching one of the levels, pay attention:
Bounce: If the price struggles at the Fibonacci level then bounces back up (if it was an uptrend) or down (if it was a downtrend), this supports the retracement idea, making it a potential zone to consider buying options.
Breakthrough: If the price bursts through one of the levels like it’s not even there, it suggests the current trend may continue.
Getting Fancy (Advanced)
As you gain more experience, you can use Fibonacci retracements in more complex ways:
Confluence: Look for other technical indicators that agree with the Fibonacci signal. For example, does the price action around the Fibonacci line also make candlestick patterns you’re familiar with? Are volume patterns in alignment with the signal?
Targets: If the price does reverse at a Fibonacci level, other lines in the sequence can help you estimate where the next move might end, aiding in options strategy selection.
When to Use (and When to Be Cautious) with Options
Here’s why Fibonacci becomes extra interesting for options trading:
Implied Volatility: A bounce-back after a retracement often aligns with shifting sentiment, influencing implied volatility (affecting options prices). This can signal the potential for bigger option trade gains in these zones.
Time as a Factor: Options have an expiration date, so Fibonacci helps pinpoint not just when price reactions might happen, but when.
Example: Using Fibonacci Retracements with Call Options
Scenario:
Stock: XYZ Corporation
Recent Trend: XYZ had a sharp price increase from $50 to $70 over a few days. It has now pulled back to around $65.
Our Goal: Determine if the pullback might be an opportunity to enter a bullish call option trade (betting the price will move higher again).
Steps
Charting Tool: Open your favorite charting software (many online brokers offer basic charting tools).
Plot XYZ: Load a chart of XYZ Corporation with a suitable timeframe (e.g., daily candlesticks showing a few weeks of activity).
Fibonacci Retracement Tool: Find your platform’s Fibonacci retracement drawing tool. Click on the peak price ($70) and drag the line down to the recent low ($50). Horizontal lines should automatically appear on the chart at the common Fibonacci ratios (23.6%, 38.2%, 61.8%, etc.).
Visual Example
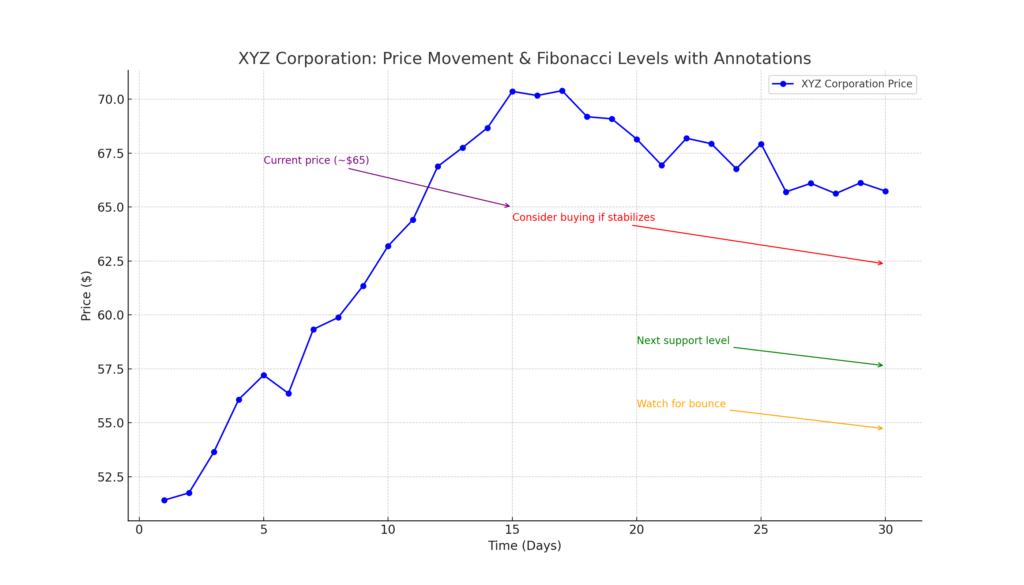
Photo: XYZ Corp FibRetracement | EconEgg
Candlestick Chart of XYZ showing its recent move up to $70 and the pullback.
Horizontal lines are drawn across the chart at approximately $66.50 (23.6%), $63.40 (38.2%), and $58.20 (61.8%).
Analysis
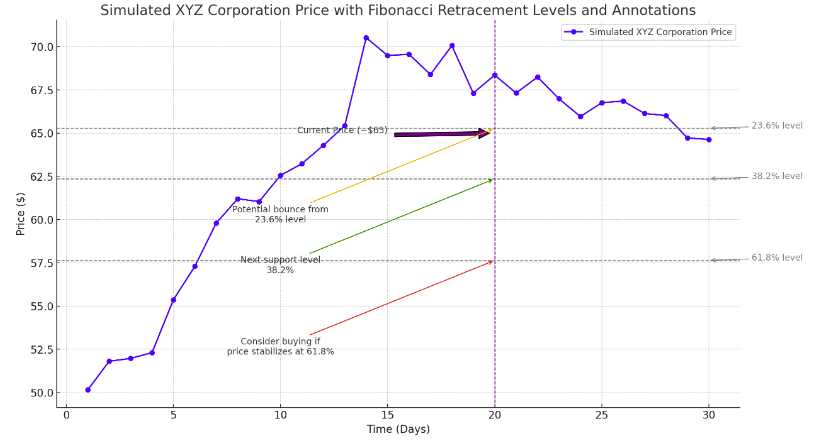
Photo: XYZ Corp Labeled | EconEgg
Current Situation: XYZ is hovering around $65, just above the 23.6% retracement level.
Watch: Depending on your risk tolerance, you might consider:
Cautious: Observe if the 23.6% level acts as support. A bounce up from here could signal buying a call option.
More Aggressive: If you believe the retracement is over, you might buy a call now. If this is your approach, keep in mind that the 23.6% line would be an area to consider placing a stop-loss order if the price continues the drop.
The chart represents a simulated price movement of a stock called XYZ Corporation, showcasing how Fibonacci retracement levels can be used to analyze and predict potential support and resistance levels after a significant price change.
Here’s the interpretation of the chart based on the annotations:
Price Movement: The blue line indicates the stock’s price over time. The price shows a sharp increase from around $50 to a peak of $70, which is followed by a pullback towards $65.
The 23.6% level (at approximately $65.28) is the shallowest retracement and is often considered the first level of support after a price increase. The stock is currently hovering just below this level, which aligns with the recent pullback to $65.
The 38.2% level (at approximately $62.36) is a deeper retracement and may serve as the next level of support if the price drops below the 23.6% level. It’s a more conservative level to watch for potential buying opportunities.
The 61.8% level (at approximately $57.64) is known as the ‘golden ratio’ and is often observed as a critical support level in a deeper retracement. If the price falls to this level, it could indicate a significant pullback but also a potential entry point for a long position if the price shows signs of stabilizing.
Current Price: The purple vertical dashed line marks the current day, which is aligned with the price level of approximately $65.
Annotations:
“Potential Bounce” suggests that if the price finds support at the 23.6% level, it might bounce back up, providing a good entry point for a bullish position, such as buying a call option.
“Support Level” indicates that the 38.2% level could be a more conservative point to consider entering a bullish position if the 23.6% level does not hold.
“Significant Retracement” at the 61.8% level implies that this point could be a strong support level, and if the price stabilizes here, it could be a strong signal to buy.
Overall, the chart is a tool used by traders to determine strategic points for entering or exiting trades based on the likelihood of price reactions at these Fibonacci levels. It combines the principles of technical analysis with psychological factors that may influence trader behavior at these key percentages.
Essential Reminders
Overall Market: Consider if the broad market supports a move upward in XYZ.
More Indicators: Do other indicators of momentum align with a potential bounce?
Option Selection: Select a strike price and expiry date for your option considering where the Fibonacci levels suggest the price might go.
Manage Risk: Even with the best analysis, always be prepared for various outcomes. Fibonacci isn’t perfect; the stock might break right through any of the lines. Manage your risk wisely, don’t over-rely on any single tool, and use stop-loss orders.
Disclaimer
This article is for informational purposes only and does not constitute financial advice. Always conduct your own research and consult with a financial advisor before making investment decisions.

Leave a Reply