Your cart is currently empty!
Understanding the Relative Strength Index (RSI)
Stock Data – Coded in Python. Justin A (2024, Jan 25).
What is the Relative Strength Index (RSI)?
The Relative Strength Index, or RSI, is a simple yet powerful tool used in stock market analysis. Think of it as a speedometer for a stock’s price movement. Developed by J. Welles Wilder, the RSI helps investors understand whether a stock is potentially priced too high or too low.
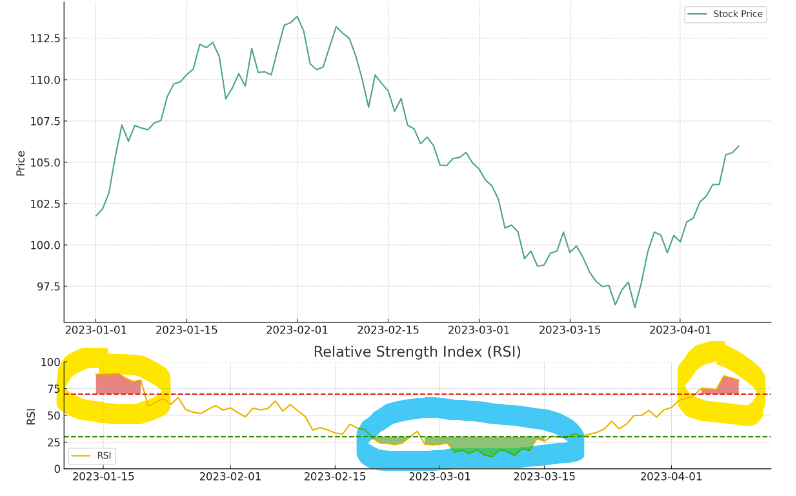
Imagine you’re looking at a roller coaster; the RSI can tell you when the ride is reaching its highest or lowest points. If the RSI number is above 70, it’s like the roller coaster is at a high point and might soon come down. This is what traders call “overbought.” On the other hand, if the RSI is below 30, it’s like the roller coaster is at a low point and could start going up, known as “oversold.”
The RSI is a favorite tool for many because it’s easy to use and works with different kinds of stocks and time frames, making it useful whether you’re looking at short-term or long-term investments. It’s like having a helpful guide that warns you about the big ups and downs in the stock market, making it a popular topic for anyone interested in understanding and discussing stock market trends.
How RSI Works
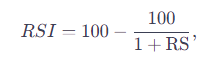
- RSI Calculation: The RSI is calculated using the formula above where RS (Relative Strength) is the average of ‘n’ days’ up closes divided by the average of ‘n’ days’ down closes. The standard setting for ‘n’ is 14 periods.
- RSI Range: RSI ranges from 0 to 100.
- Overbought and Oversold Levels: Traditionally, an RSI above 70 is considered overbought, and an RSI below 30 is considered oversold.
Using RSI for Trading Decisions
- Overbought and Oversold Indications:
- Overbought: An RSI reading above 70 suggests that a stock might be overvalued and due for a pullback or reversal.
- Oversold: Conversely, an RSI below 30 indicates the stock might be undervalued and could rebound.
- RSI Divergences:
- A bullish divergence occurs when the RSI forms higher lows while the stock price sets lower lows. This can be a sign of a coming upward reversal.
- A bearish divergence happens when the RSI creates lower highs while the stock price sets higher highs, indicating a potential downward reversal.
- RSI Swing Rejections:
- This technique involves identifying situations where the RSI moves out of overbought or oversold territory and re-enters. These swing rejections can signal a potential reversal.
Examples
- Example of Overbought Signal:
- Suppose Stock A has been rising rapidly and its RSI reaches 78.
- This high RSI could indicate that the stock is overbought, and traders might anticipate a price pullback.
- Example of Oversold Signal:
- Consider Stock B experiencing a steep decline, with its RSI dropping to 22.
- This low RSI suggests the stock is oversold, and traders may expect a price rebound.
- Example of Bullish Divergence:
- Stock C shows a declining price trend, but its RSI starts forming higher lows.
- This divergence might signal an upcoming bullish reversal, prompting traders to consider buying.
- Example of Bearish Divergence:
- Stock D’s price is trending upward, but its RSI begins to form lower highs.
- This bearish divergence can be an early warning of a potential downward reversal.
Conclusion
Using RSI in stock analysis provides valuable insights into market momentum and potential price reversals. It’s crucial for traders to combine RSI analysis with other indicators and fundamental analysis for more reliable trading decisions. Remember, no indicator is foolproof; they should be used as part of a broader strategy.
Disclaimer
This article is for informational purposes only and does not constitute financial advice. Always conduct your own research and consult with a financial advisor before making investment decisions.
Leave a Reply